
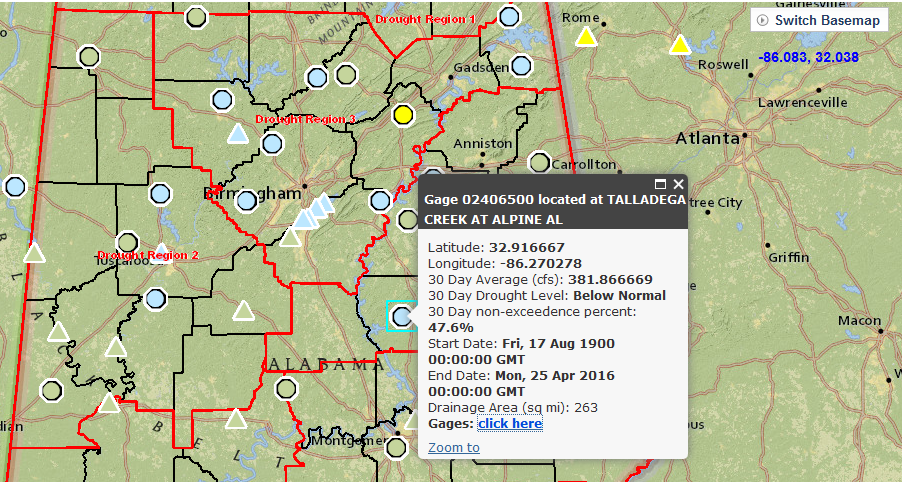
Information shown on the map provides drought and low-flow streamflow conditions at selected sites across Alabama. The information is available for four specific time periods: 7, 30, 60, and 90-day statistical summaries.
Drought Data Portal
Click for Interactive Map
This application provides drought and low-flow streamflow information for selected regulated and unregulated gages that impact Alabama. Graphs are usually updated on a weekly basis and posted on Monday. By clicking on a particular location, you are provided information about current streamflow conditions at that site. By clicking on the Graph area of that information, you are provided with detailed hydrological summaries that include: 7, 30, 60, and 90-day average flows with calculated exceedance percentiles as of the report date; Plots of 7-day minimum flows and the associated frequency curve; and Additional graphical and tabular summaries of the data.
PDF documents of the 7 Day, 30 Day, 60 Day or 90 Day maps can be downloaded by clicking the appropriate link. Click your browser back button or one of the links located in the map header to return to the OWR GIS Portal or OWR Main page.